> ## Documentation Index
> Fetch the complete documentation index at: https://docs.hubtalk.ai/llms.txt
> Use this file to discover all available pages before exploring further.
# Dashboard
> Configurable dashboards built from a widget catalog: what gets counted and over which period.
# Dashboard
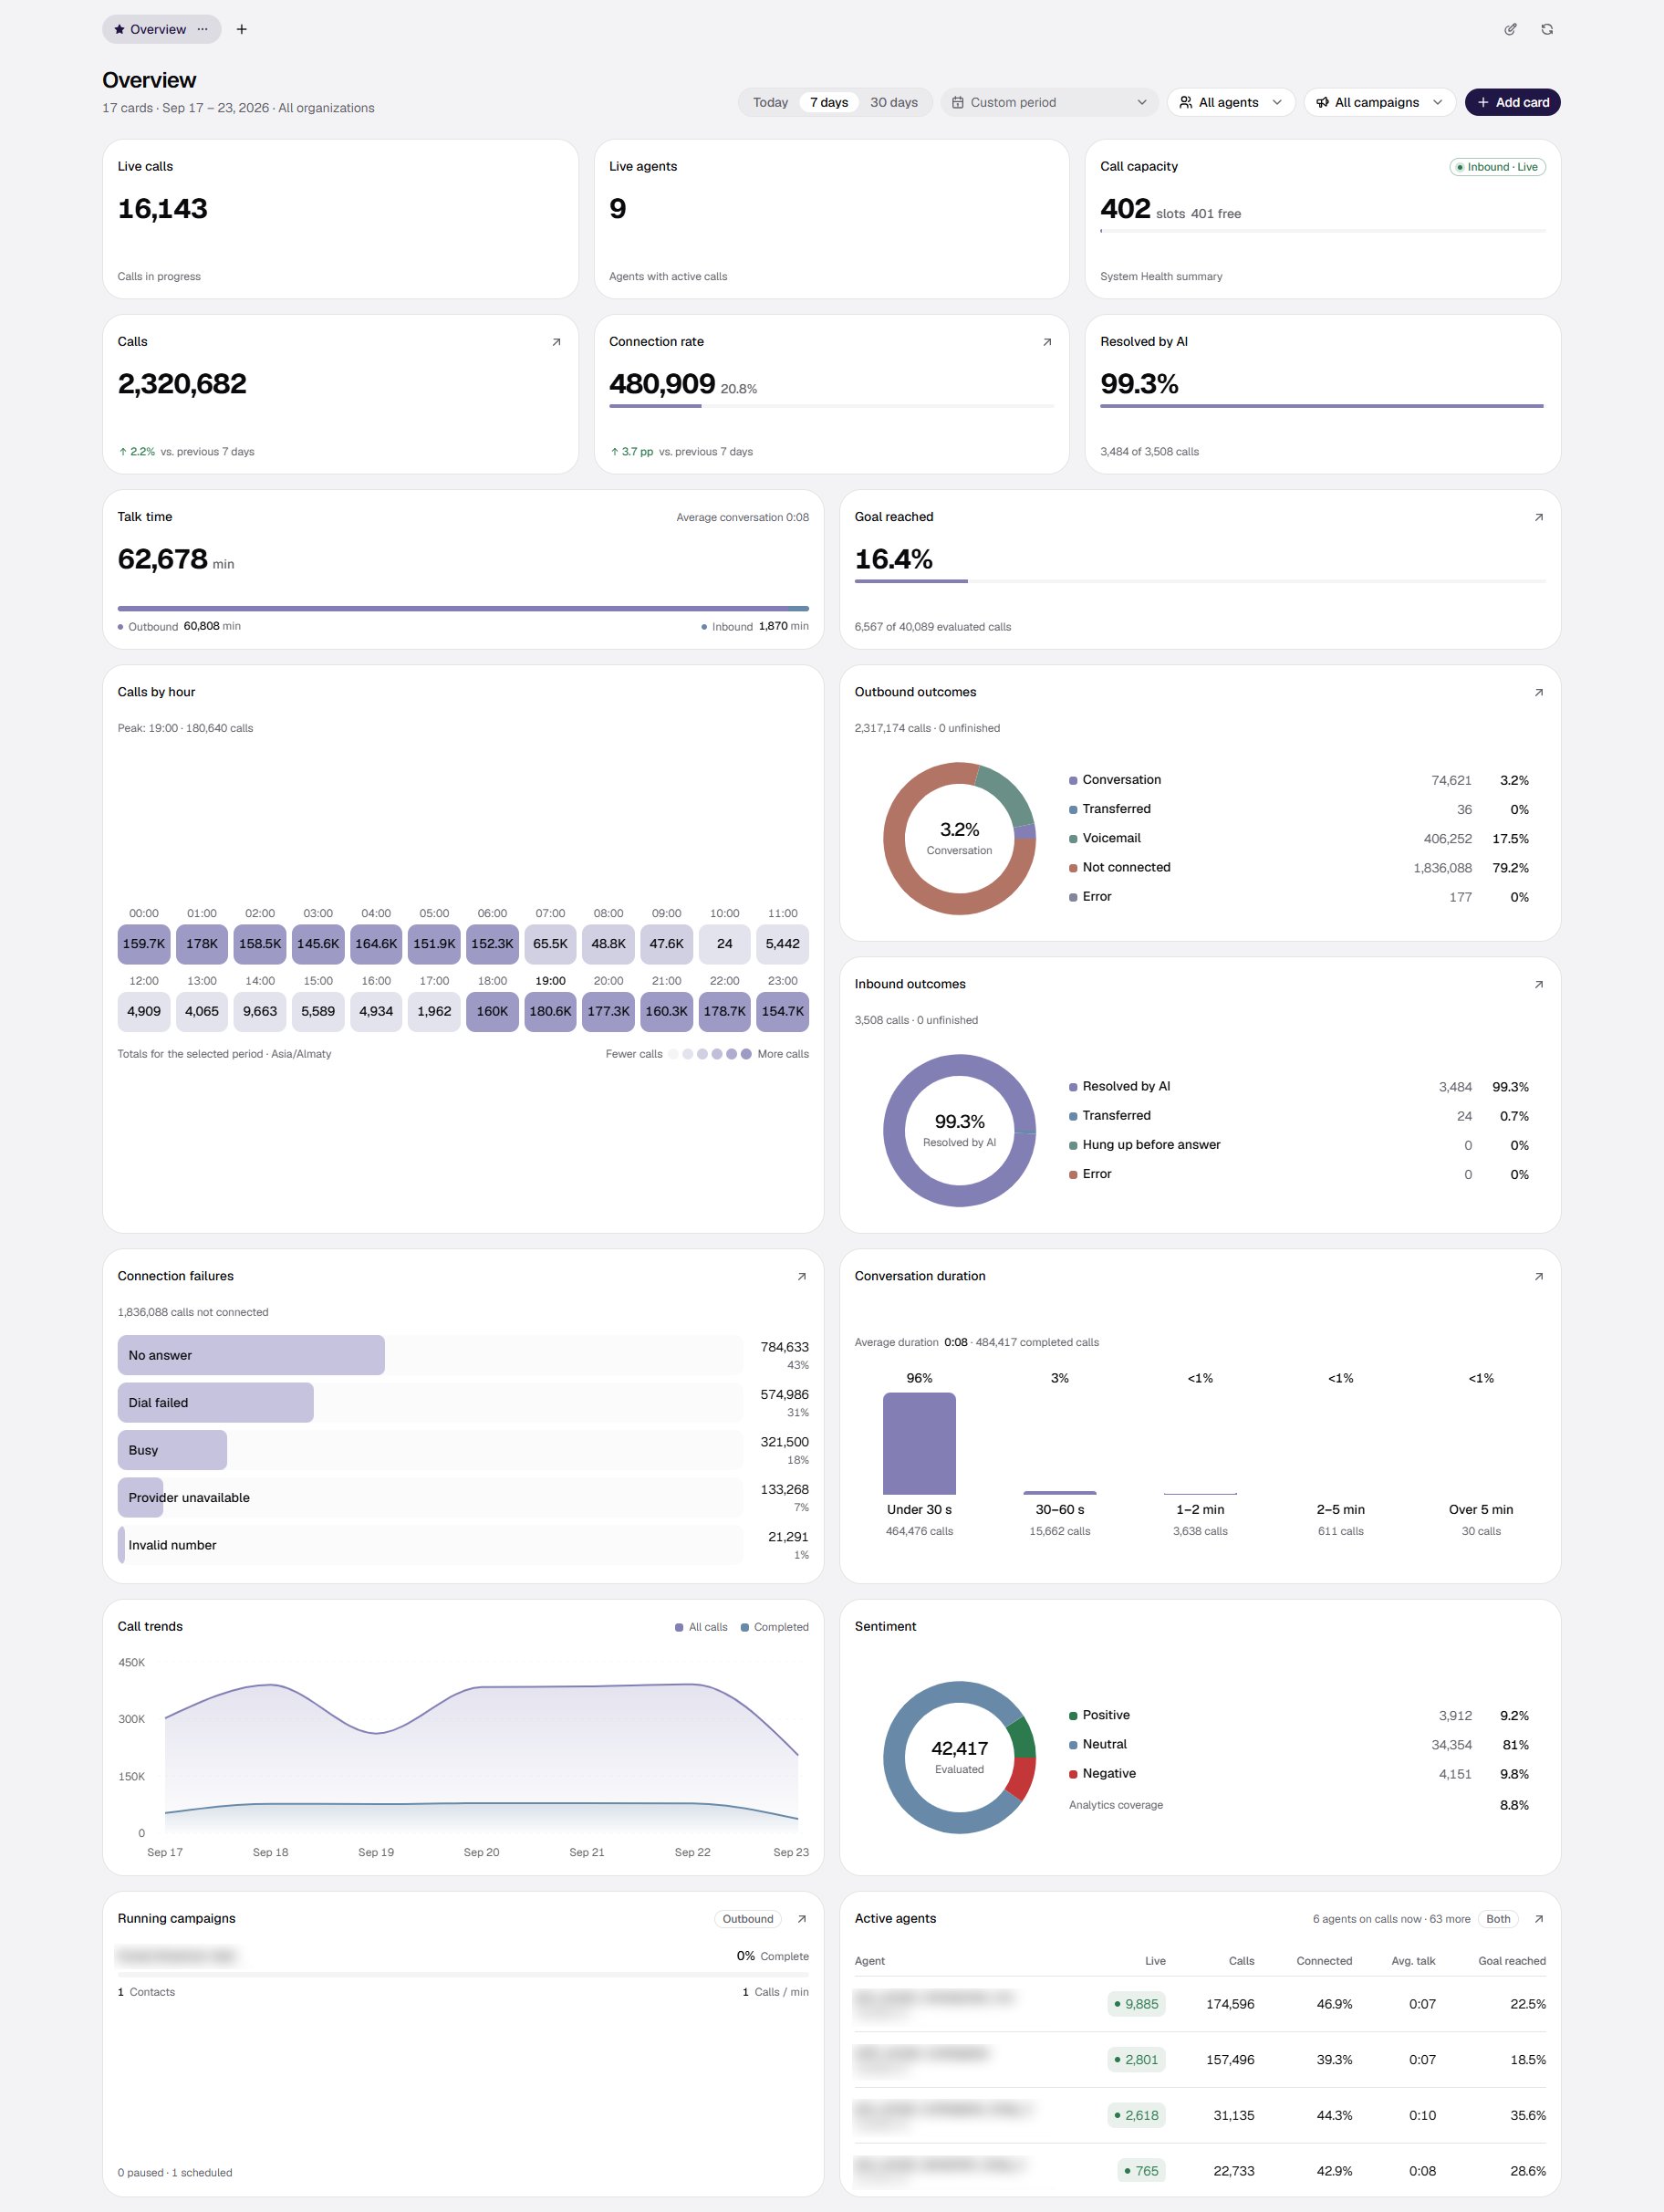
The **Dashboard** section is the operational summary of your organization's calls: how many calls there were, how many reached a conversation, how they ended, and what is happening right now. A dashboard is built from cards, and each card is a widget from the catalog with its own settings.
## What you meet on day one
Every organization gets an **Overview** dashboard that the platform creates for it: 16 cards covering the usual questions. You do not have to assemble it — it is ready, and you can edit it like any of your own: rename it, move cards around, remove some, add others.
* **Up to 10 dashboards** per organization; the name is unique within the organization.
* **Up to 30 cards** per dashboard.
* **Exactly one dashboard is the default** — marked with a star and opened first. The last dashboard cannot be deleted: the screen has to show something.
Dashboards belong to the organization, not to you: what you create or rename, your colleagues see. This is not a personal setting.
 ## Period and filters
The header carries the period (**Today**, **7 days**, **30 days** or a custom range), the agent filter and the campaign filter. All three:
* are **not stored in the dashboard** — they are your way of looking, not a property of the cards. A colleague opening the same dashboard sees their own period;
* **live in the page address**, so a link with the right period, agents and campaigns can be sent to a colleague;
* **apply to every card at once**. A card has no period of its own.
The campaign filter works like the agent one: a multi-select with search by name, listing the same campaigns as History. The two combine with **AND**: an agent plus a campaign gives that agent's calls in that campaign. A card's link into History carries the campaign when exactly one is selected.
A custom range is at most **92 days**. Dates are read in the organization's time zone (or yours, if you overrode it); the zone is shown in the tooltip on the dates.
**A preset is resolved again on every refresh.** A page opened in the evening and left until morning will show the new "7 days" after midnight rather than yesterday's frozen window. That is why the address stores `7d` and not a pair of dates.
## What counts as a call
This is the thing to know before you reconcile dashboard figures with anything else.
* **The unit is a call, not a dial attempt.** Three dials of one contact, answered on the third, are three campaign attempts and one conversation. Attempts live on the campaign card, not here.
* **Only phone calls in live mode are counted.** There are two conditions and they are independent. **The channel must be phone:** chats, the dashboard voice test, web calls and WhatsApp are not counted at all. **The mode must be live:** a real phone call placed in test mode is not counted either. Neither **Calls** nor **Live calls** includes such conversations.
* **The single exception is the Running campaigns card**: it looks at campaigns and their attempts, because that is exactly what people open it for.
**Do not reconcile dashboard Calls against the row count in History directly.** History shows every channel and both modes, the dashboard shows live telephony only. A difference here is not an error — they answer different questions.
## Widget catalog
**Add card** opens the catalog. Widgets are grouped by the question they answer. The bottom of the window shows how many of the thirty card slots the dashboard already uses.
## Period and filters
The header carries the period (**Today**, **7 days**, **30 days** or a custom range), the agent filter and the campaign filter. All three:
* are **not stored in the dashboard** — they are your way of looking, not a property of the cards. A colleague opening the same dashboard sees their own period;
* **live in the page address**, so a link with the right period, agents and campaigns can be sent to a colleague;
* **apply to every card at once**. A card has no period of its own.
The campaign filter works like the agent one: a multi-select with search by name, listing the same campaigns as History. The two combine with **AND**: an agent plus a campaign gives that agent's calls in that campaign. A card's link into History carries the campaign when exactly one is selected.
A custom range is at most **92 days**. Dates are read in the organization's time zone (or yours, if you overrode it); the zone is shown in the tooltip on the dates.
**A preset is resolved again on every refresh.** A page opened in the evening and left until morning will show the new "7 days" after midnight rather than yesterday's frozen window. That is why the address stores `7d` and not a pair of dates.
## What counts as a call
This is the thing to know before you reconcile dashboard figures with anything else.
* **The unit is a call, not a dial attempt.** Three dials of one contact, answered on the third, are three campaign attempts and one conversation. Attempts live on the campaign card, not here.
* **Only phone calls in live mode are counted.** There are two conditions and they are independent. **The channel must be phone:** chats, the dashboard voice test, web calls and WhatsApp are not counted at all. **The mode must be live:** a real phone call placed in test mode is not counted either. Neither **Calls** nor **Live calls** includes such conversations.
* **The single exception is the Running campaigns card**: it looks at campaigns and their attempts, because that is exactly what people open it for.
**Do not reconcile dashboard Calls against the row count in History directly.** History shows every channel and both modes, the dashboard shows live telephony only. A difference here is not an error — they answer different questions.
## Widget catalog
**Add card** opens the catalog. Widgets are grouped by the question they answer. The bottom of the window shows how many of the thirty card slots the dashboard already uses.
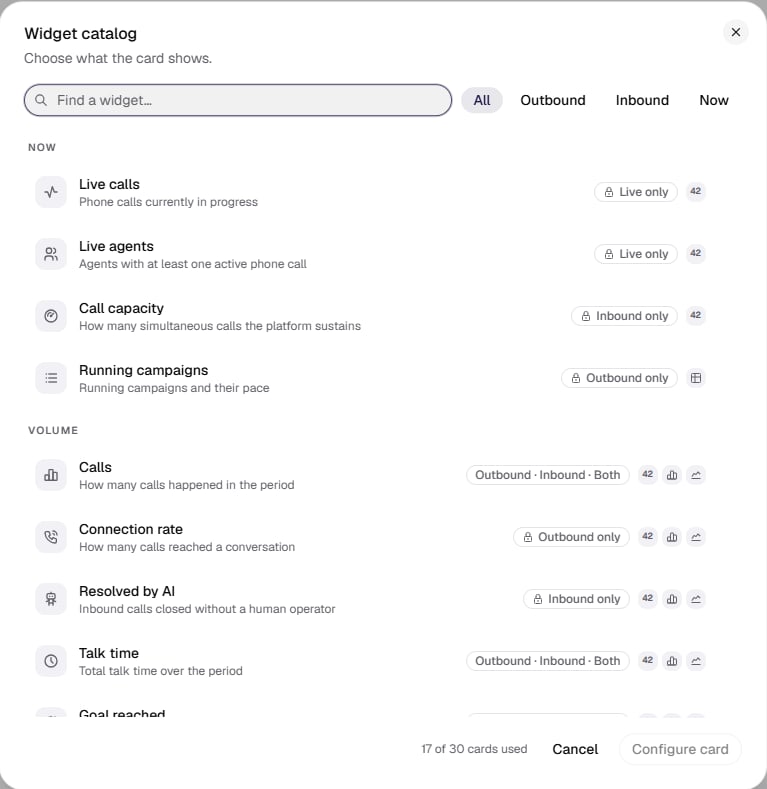 A widget in the catalog carries badges for what it allows: a **lock** reading "Inbound only" or "Outbound only" means the direction is fixed and cannot be changed in the settings; the icons beside it are the chart types the widget supports.
### Now
| Widget | What it shows |
| --------------------- | -------------------------------------------------------------------------------------------------------------------- |
| **Live calls** | Phone calls in progress right now. |
| **Live agents** | How many agents currently hold at least one call. |
| **Running campaigns** | A table of running campaigns: contacts, progress, pace. The caption says how many are paused and how many scheduled. |
| **Recent agents** | Recently changed agents and their version. |
| **Recent sessions** | Latest sessions with outcome and duration; a row leads into History. |
### Volume
| Widget | What it shows |
| --------------------- | --------------------------------------------------------------------------------------------------------- |
| **Calls** | How many calls happened in the period. |
| **Connection rate** | How many outbound calls reached a conversation, as a count and a share. |
| **Resolved by AI** | Share of inbound calls closed without a handover to a human. |
| **Talk time** | Total talk time; the caption gives the average per connected call. |
| **Goal reached** | Share of conversations whose goal was reached — out of **evaluated** ones, not out of all. |
| **Calls by campaign** | Calls of the period by campaign: the top five, a tail, and a separate row for calls outside any campaign. |
### Outcome
| Widget | What it shows |
| ----------------------- | ------------------------------------------------------------------------------------------------------------------------------------------------------------------ |
| **Outbound outcomes** | A ring over outbound calls: talk, transfer, voicemail, no connection, error. |
| **Inbound outcomes** | A ring over inbound calls: resolved by AI, transfer, hang-up before answer, error. Inbound calls have no voicemail or no-answer category, and the caption says so. |
| **Connection failures** | Reasons for not connecting, by frequency: top 5 plus "other". |
| **Sentiment** | Three sentiment values from post-call analytics, alongside the share of calls analytics actually evaluated. |
| **Analytics field** | The distribution of one of your post-call fields — see below. |
### Time
| Widget | What it shows |
| ------------------------- | ------------------------------------------------------------------------- |
| **Conversation duration** | Distribution across five duration buckets; the average is in the caption. |
| **Calls by hour** | 24 columns by hour of day in your time zone; the peak is in the caption. |
| **Call trends** | A line: calls and connection rate by day, week or month. |
### Agents
| Widget | What it shows |
| ----------------- | ------------------------------------------------------------------------------------------------- |
| **Active agents** | A table of agents active in the period: live now, calls, connection rate, average duration, goal. |
A card lets you set the **direction** (outbound, inbound or both), the **chart type** (number, ring, bars, columns, line, table) and the **grain** (day, week, month). Invalid combinations cannot be picked in the form rather than being pickable and producing a dash: a ring only draws shares that add up to 100 %, and the "hour" grain exists only on **Calls by hour**.
## The Analytics field widget
One card stands apart: it shows the distribution of **your** post-call analytics field — the value the agent extracts from the conversation after the call.
* **One card, one agent, one field.** Fields of different agents that share a name are not merged: there is no guarantee they mean the same thing.
* **Structured fields are counted**: value lists and yes/no give a distribution (ring, bars or table, top 5 plus "other"), numeric fields give an average and a count of measurements. Free text and lists are not offered in the catalog: a distribution over free text is not a distribution.
* Clicking a value opens History narrowed to that agent and that value.
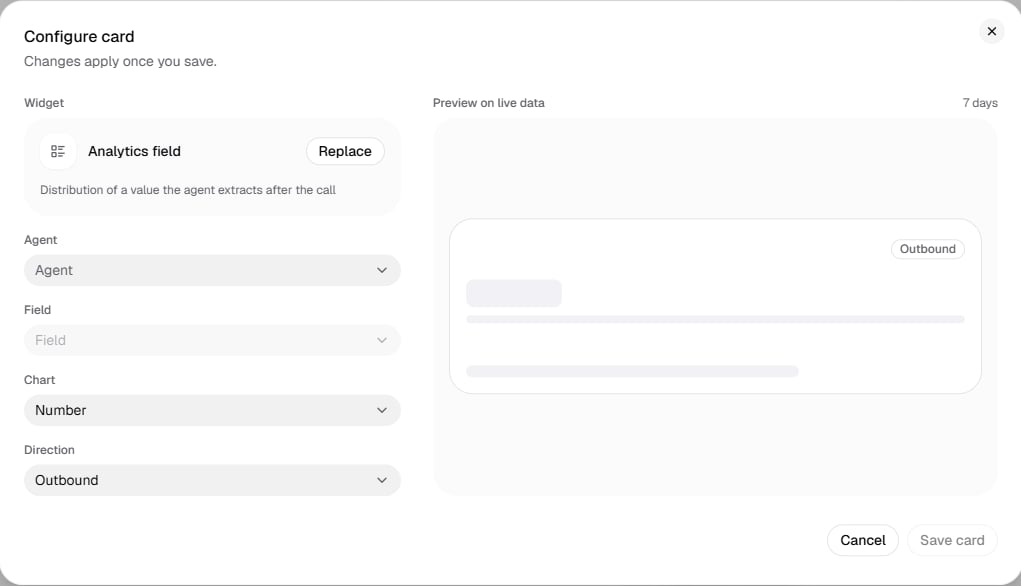
A card is configured in its own window: the settings on the left, a preview on live data over 7 days on the right. Unavailable values are disabled — until an agent is chosen, the field cannot be picked.
A widget in the catalog carries badges for what it allows: a **lock** reading "Inbound only" or "Outbound only" means the direction is fixed and cannot be changed in the settings; the icons beside it are the chart types the widget supports.
### Now
| Widget | What it shows |
| --------------------- | -------------------------------------------------------------------------------------------------------------------- |
| **Live calls** | Phone calls in progress right now. |
| **Live agents** | How many agents currently hold at least one call. |
| **Running campaigns** | A table of running campaigns: contacts, progress, pace. The caption says how many are paused and how many scheduled. |
| **Recent agents** | Recently changed agents and their version. |
| **Recent sessions** | Latest sessions with outcome and duration; a row leads into History. |
### Volume
| Widget | What it shows |
| --------------------- | --------------------------------------------------------------------------------------------------------- |
| **Calls** | How many calls happened in the period. |
| **Connection rate** | How many outbound calls reached a conversation, as a count and a share. |
| **Resolved by AI** | Share of inbound calls closed without a handover to a human. |
| **Talk time** | Total talk time; the caption gives the average per connected call. |
| **Goal reached** | Share of conversations whose goal was reached — out of **evaluated** ones, not out of all. |
| **Calls by campaign** | Calls of the period by campaign: the top five, a tail, and a separate row for calls outside any campaign. |
### Outcome
| Widget | What it shows |
| ----------------------- | ------------------------------------------------------------------------------------------------------------------------------------------------------------------ |
| **Outbound outcomes** | A ring over outbound calls: talk, transfer, voicemail, no connection, error. |
| **Inbound outcomes** | A ring over inbound calls: resolved by AI, transfer, hang-up before answer, error. Inbound calls have no voicemail or no-answer category, and the caption says so. |
| **Connection failures** | Reasons for not connecting, by frequency: top 5 plus "other". |
| **Sentiment** | Three sentiment values from post-call analytics, alongside the share of calls analytics actually evaluated. |
| **Analytics field** | The distribution of one of your post-call fields — see below. |
### Time
| Widget | What it shows |
| ------------------------- | ------------------------------------------------------------------------- |
| **Conversation duration** | Distribution across five duration buckets; the average is in the caption. |
| **Calls by hour** | 24 columns by hour of day in your time zone; the peak is in the caption. |
| **Call trends** | A line: calls and connection rate by day, week or month. |
### Agents
| Widget | What it shows |
| ----------------- | ------------------------------------------------------------------------------------------------- |
| **Active agents** | A table of agents active in the period: live now, calls, connection rate, average duration, goal. |
A card lets you set the **direction** (outbound, inbound or both), the **chart type** (number, ring, bars, columns, line, table) and the **grain** (day, week, month). Invalid combinations cannot be picked in the form rather than being pickable and producing a dash: a ring only draws shares that add up to 100 %, and the "hour" grain exists only on **Calls by hour**.
## The Analytics field widget
One card stands apart: it shows the distribution of **your** post-call analytics field — the value the agent extracts from the conversation after the call.
* **One card, one agent, one field.** Fields of different agents that share a name are not merged: there is no guarantee they mean the same thing.
* **Structured fields are counted**: value lists and yes/no give a distribution (ring, bars or table, top 5 plus "other"), numeric fields give an average and a count of measurements. Free text and lists are not offered in the catalog: a distribution over free text is not a distribution.
* Clicking a value opens History narrowed to that agent and that value.
A card is configured in its own window: the settings on the left, a preview on live data over 7 days on the right. Unavailable values are disabled — until an agent is chosen, the field cannot be picked.
 **The figures come from the calls, the field's description from the agent.** These are two different sources and are worth keeping apart.
**What is counted** — the values recorded on completed live calls. The agent's settings do not change them: the categories are built from what actually came up, top 5 plus "other". A value you removed from the list on the agent does not disappear from the card — there were calls carrying it.
**What comes from the agent** — only the field's declaration: whether it still has the field and what type it is. Two consequences follow:
* **remove the field from the agent** and the card says its settings are no longer supported — straight away, even if the edit has not been published and live calls keep writing that field;
* **change the field's type** (value list ↔ number) and the card switches between a distribution and an average.
This is a deliberate trade: reading, for every card, the version that ran every call would mean loading version history on every recount.
## Three states of a value
A card never shows an invented number. Tell three things apart:
* **A number** — computed. Zero here is real: zero live calls, and 0 % against a known non-zero denominator, are values rather than emptiness.
* **A dash "—"** — it cannot be computed exactly, and the tooltip names the reason: historical data is still loading, totals are being rebuilt, the source is unavailable, hourly data is not computed in time zones with a fractional-hour offset.
* **An empty state with a caption** — there is nothing to count: no observations in the period, or a zero denominator (for instance, not a single call was evaluated for its goal).
The difference between a dash and a zero is the point: a wrong number is worse than a dash, and the platform would rather decline to answer than show a zero where the truth is "unknown".
**Right after the dashboard is switched on, some cards for past periods show the dash "Historical data is still loading".** The platform recounts call history in the background; the "now" cards work from the first minute, period cards fill in as the count progresses. This is a one-off state after the upgrade, not permanent behaviour.
## Comparison with the previous period
Numeric cards carry a comparison under the value — "vs previous 7 days" or "vs previous 30 days". The window is shifted back by exactly that many calendar days and cut at the same time of day: "7 days up to now" is compared with "7 days up to the same moment a week earlier".
**Today** and custom ranges carry no comparison. "Versus yesterday up to this hour" is a different question, and merging the two under one caption would put two different quantities behind one label.
## Layout
**Edit layout** turns on edit mode: cards grow handles, and you can drag them and resize them by their edges and corners. The grid has 12 columns.
* **Gaps are preserved.** The platform does not compact the layout for you: a space you left stays. Only the neighbours a card actually overlaps are pushed aside.
* **Edits accumulate and are sent in a single save.** **Cancel** returns everything to the saved state, and leaving the page with unsaved edits asks for confirmation.
* **From the keyboard:** Space or Enter starts a move or a resize, arrow keys step, Enter finishes, Escape undoes the current gesture.
* **On a narrow screen** cards fall into one column in reading order and the handles are gone. The saved layout does not change — only the display does.
## Data freshness
The active tab refreshes **every 30 seconds**, and immediately when you return to the window or the connection comes back. Background tabs do not poll the server.
If a refresh fails, the cards keep their previous values with an explicit note that this is the last available data. A live value is never passed off as a new one.
## Roles
* **Admin** and **developer** edit dashboards in full.
* A **member** sees dashboards, switches tabs, changes the period and the filter — but does **not** edit: the add button, the card menu and the dashboard menu are not there at all. They are absent rather than disabled — see [Roles and access](/v4/platform/roles).
**The figures come from the calls, the field's description from the agent.** These are two different sources and are worth keeping apart.
**What is counted** — the values recorded on completed live calls. The agent's settings do not change them: the categories are built from what actually came up, top 5 plus "other". A value you removed from the list on the agent does not disappear from the card — there were calls carrying it.
**What comes from the agent** — only the field's declaration: whether it still has the field and what type it is. Two consequences follow:
* **remove the field from the agent** and the card says its settings are no longer supported — straight away, even if the edit has not been published and live calls keep writing that field;
* **change the field's type** (value list ↔ number) and the card switches between a distribution and an average.
This is a deliberate trade: reading, for every card, the version that ran every call would mean loading version history on every recount.
## Three states of a value
A card never shows an invented number. Tell three things apart:
* **A number** — computed. Zero here is real: zero live calls, and 0 % against a known non-zero denominator, are values rather than emptiness.
* **A dash "—"** — it cannot be computed exactly, and the tooltip names the reason: historical data is still loading, totals are being rebuilt, the source is unavailable, hourly data is not computed in time zones with a fractional-hour offset.
* **An empty state with a caption** — there is nothing to count: no observations in the period, or a zero denominator (for instance, not a single call was evaluated for its goal).
The difference between a dash and a zero is the point: a wrong number is worse than a dash, and the platform would rather decline to answer than show a zero where the truth is "unknown".
**Right after the dashboard is switched on, some cards for past periods show the dash "Historical data is still loading".** The platform recounts call history in the background; the "now" cards work from the first minute, period cards fill in as the count progresses. This is a one-off state after the upgrade, not permanent behaviour.
## Comparison with the previous period
Numeric cards carry a comparison under the value — "vs previous 7 days" or "vs previous 30 days". The window is shifted back by exactly that many calendar days and cut at the same time of day: "7 days up to now" is compared with "7 days up to the same moment a week earlier".
**Today** and custom ranges carry no comparison. "Versus yesterday up to this hour" is a different question, and merging the two under one caption would put two different quantities behind one label.
## Layout
**Edit layout** turns on edit mode: cards grow handles, and you can drag them and resize them by their edges and corners. The grid has 12 columns.
* **Gaps are preserved.** The platform does not compact the layout for you: a space you left stays. Only the neighbours a card actually overlaps are pushed aside.
* **Edits accumulate and are sent in a single save.** **Cancel** returns everything to the saved state, and leaving the page with unsaved edits asks for confirmation.
* **From the keyboard:** Space or Enter starts a move or a resize, arrow keys step, Enter finishes, Escape undoes the current gesture.
* **On a narrow screen** cards fall into one column in reading order and the handles are gone. The saved layout does not change — only the display does.
## Data freshness
The active tab refreshes **every 30 seconds**, and immediately when you return to the window or the connection comes back. Background tabs do not poll the server.
If a refresh fails, the cards keep their previous values with an explicit note that this is the last available data. A live value is never passed off as a new one.
## Roles
* **Admin** and **developer** edit dashboards in full.
* A **member** sees dashboards, switches tabs, changes the period and the filter — but does **not** edit: the add button, the card menu and the dashboard menu are not there at all. They are absent rather than disabled — see [Roles and access](/v4/platform/roles).